Overview
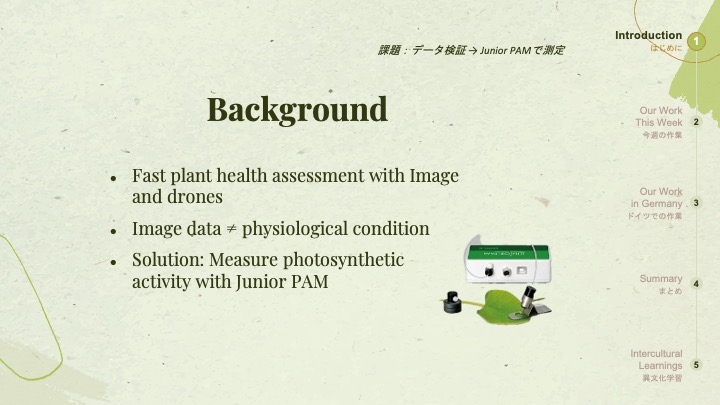
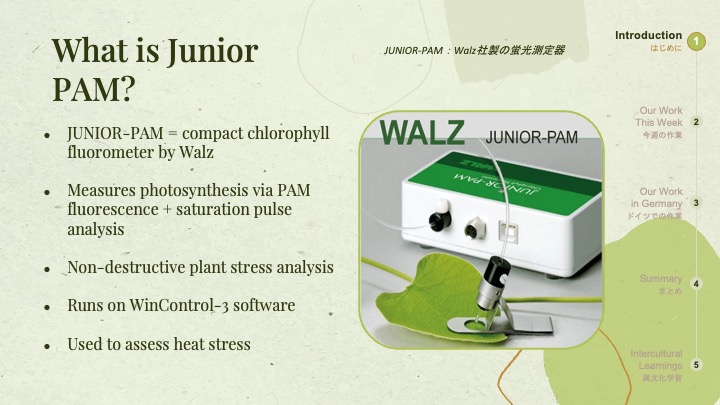
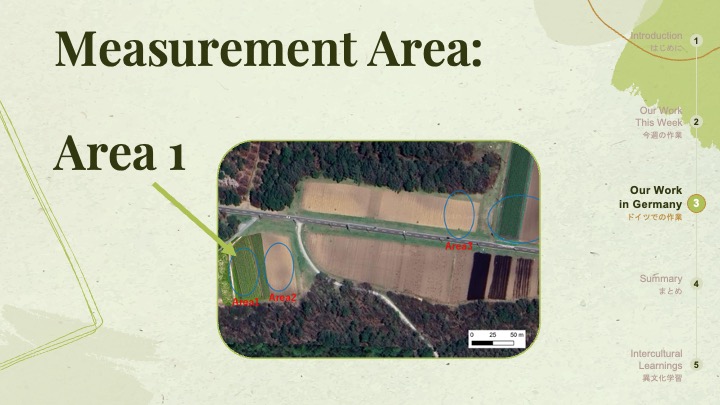
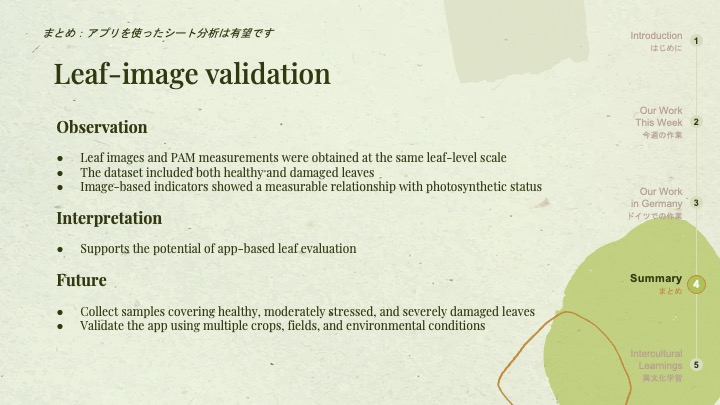
K-Lab was an international, interdisciplinary research project conducted in Japan as a collaboration between the Technical University of Applied Sciences Würzburg-Schweinfurt (THWS) and Japanese research partners. The objective was to investigate whether non-invasive, image-based crop monitoring—specifically drone multispectral indices (GNDVI) and smartphone leaf photography—accurately reflects true biological plant stress. As part of “Team PAM”, our mission was to collect physiological ground-truth data in Japanese highland corn fields using a Walz Junior-PAM chlorophyll fluorometer, and engineer an automated software pipeline to statistically evaluate and correlate findings across all research teams.
Key Features
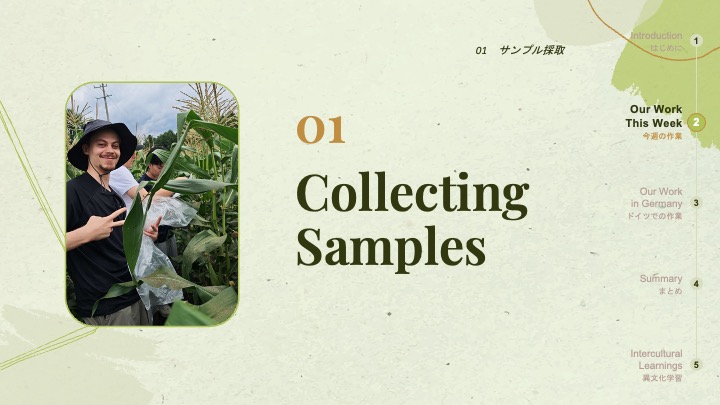
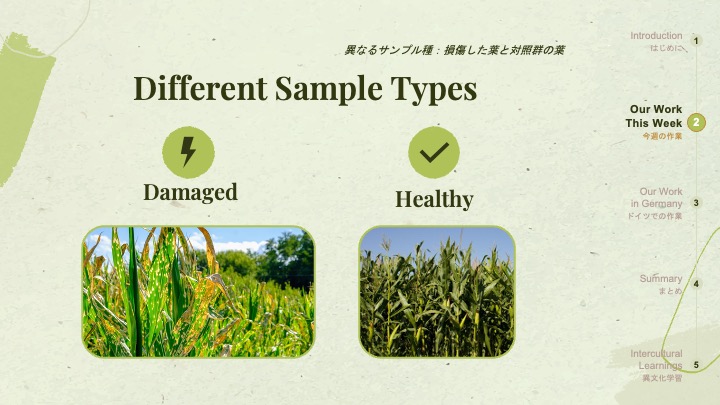
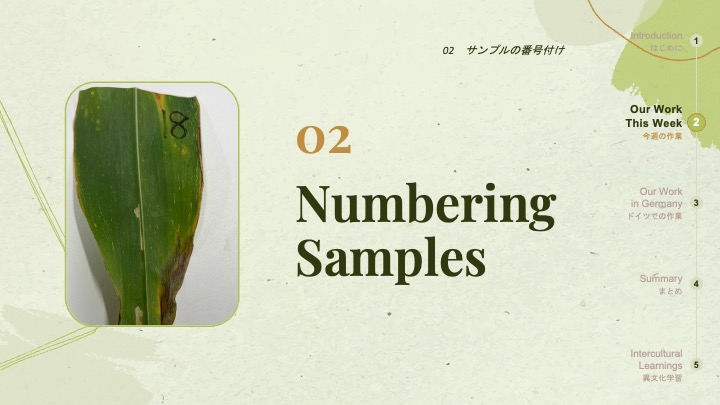
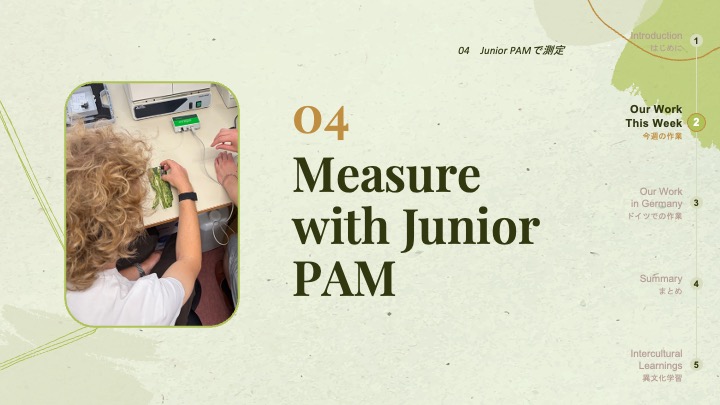
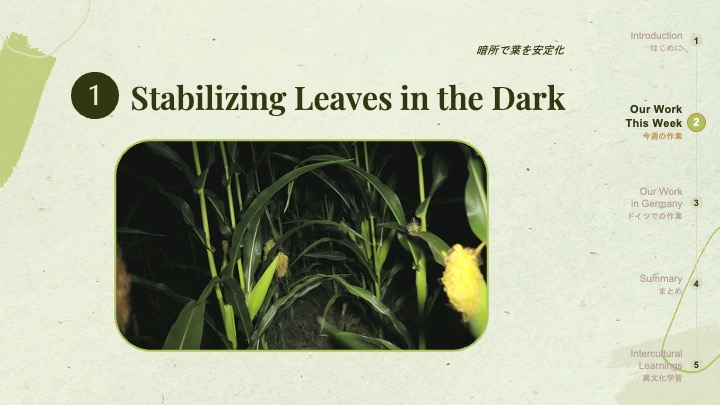
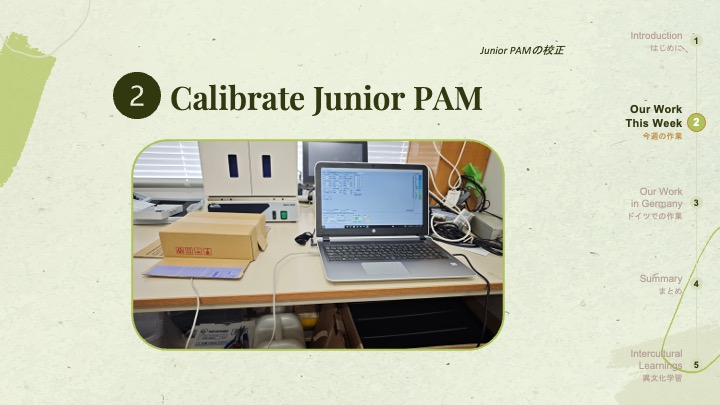
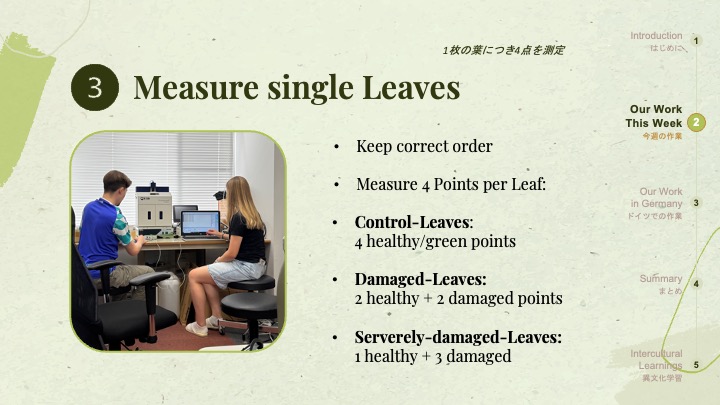
- Fieldwork & Physiological Ground Truth: Executed standardized botanical field protocols in Japan, including dark-adaptation stabilization, specimen classification (control, heat-stressed, feeding damage), and multi-point chlorophyll fluorescence (Fv/FmFv/Fm) saturation pulse measurements.
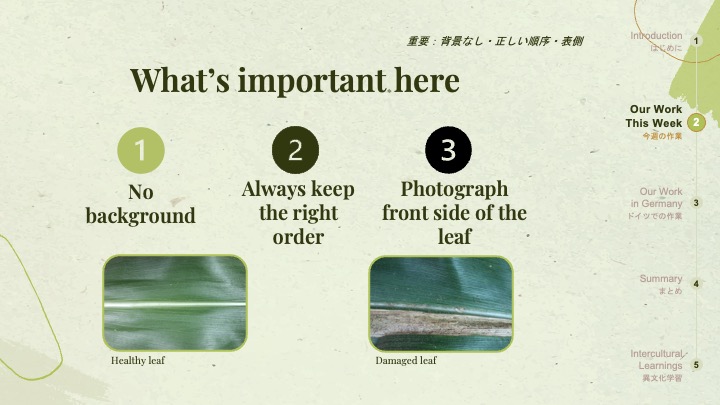
- Multi-Granular Data Harmonization: Resolved complex spatial resolution disparities by aligning plant-level PAM readings with individual smartphone leaf photographs and 2×2m multispectral drone mesh grid cells.
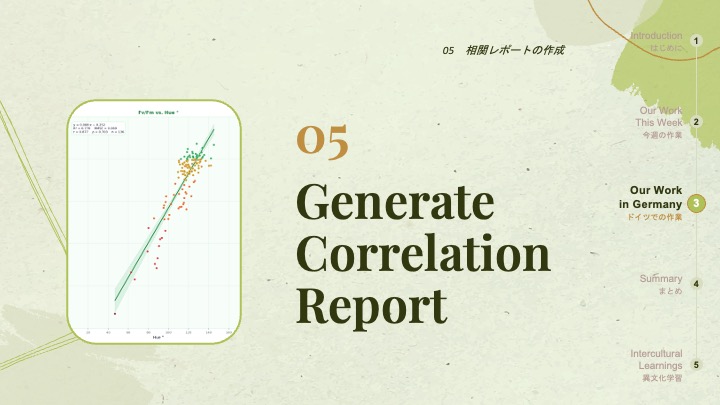
- Automated Multi-Page PDF Generation: Engineered an end-to-end reporting engine in Python calculating descriptive statistics, Pearson/Spearman correlations, and outlier detection into publication-ready A4 scientific reports.
- Cross-Platform Desktop GUI: Developed a lightweight Tkinter interface enabling non-technical lab staff to run validation pipelines and inspect real-time execution logs with a single click.
Architecture & Tech Stack
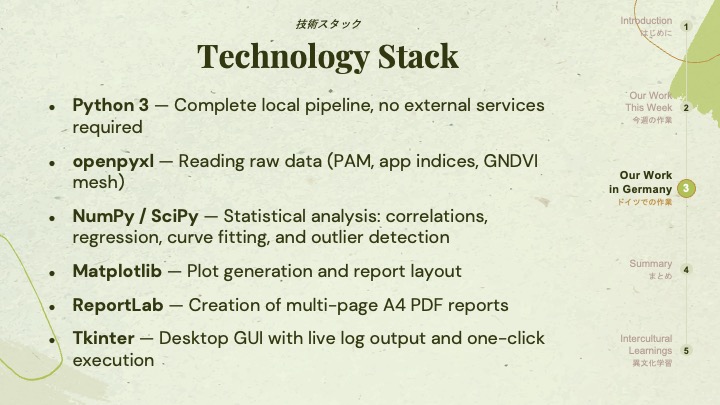
- Language & Runtime: Python 3 (fully offline, zero-dependency local execution pipeline).
- Data Engineering & Statistics:
NumPy,SciPy(regression, correlation analysis, curve fitting), andopenpyxl(PAM workbook parsing & mesh joins). - Visualization & Reporting:
Matplotlib(custom multi-panel scatter plots) andReportLab(vector PDF compilation). - GUI & Automation:
Tkinterdesktop application with one-click macOS (.command) and Windows (.bat) launcher scripts.
Highlights & Learnings
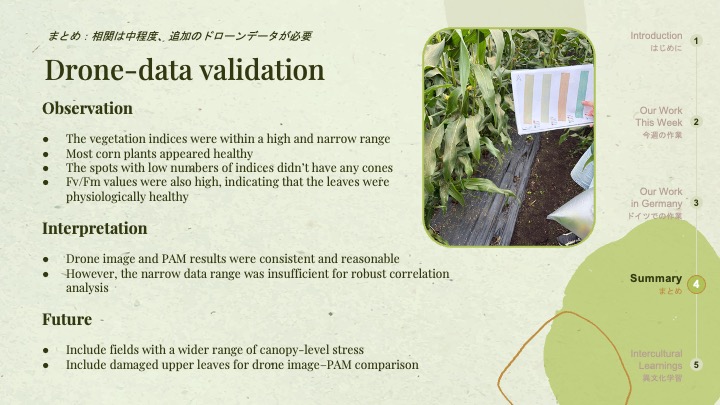
- Bridging Biological Ground Truth & Data Science: Working directly in the field demonstrated that aerial multispectral data can look deceptively healthy without physiological ground truth. Calibrating specialized fluorometer hardware under outdoor field constraints provided deep insights into data collection hygiene.
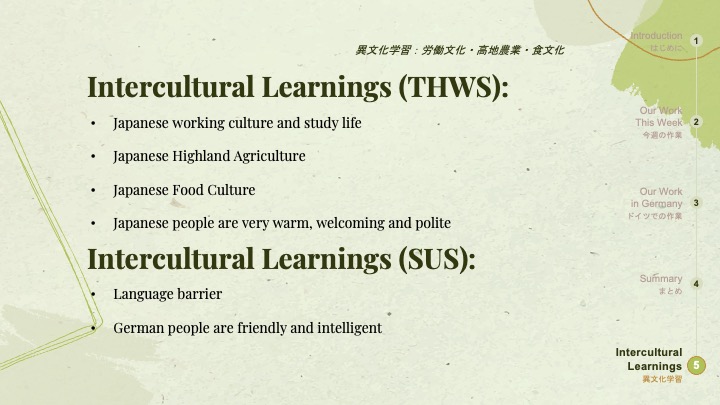
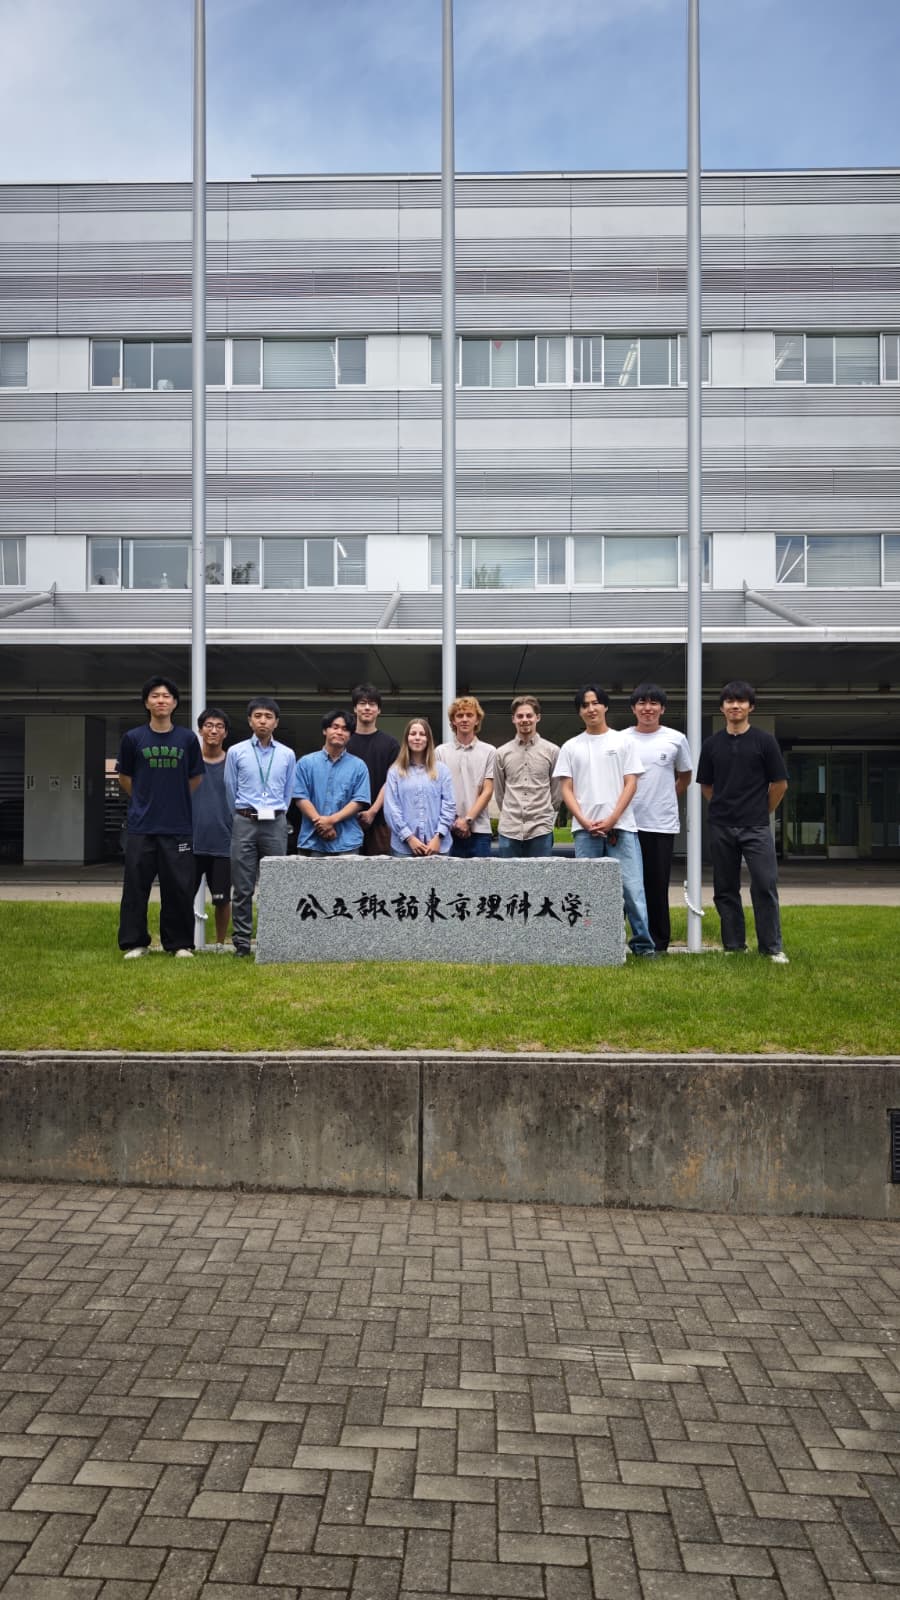
- Intercultural & Interdisciplinary Teamwork: Navigating language barriers and collaborating across Japanese highland farming culture, agronomists, and German computer science students highlighted the value of clear data contracts, adaptability, and open communication in international research.
Keynote